BlackBerry Ungkapkan Komitmennya untuk Meluncurkan Aplikasi BBM iOS dan Android
Tag :
HP,
info teknology
Aplikasi BlackBerry Messenger (BBM) untuk Android dan iOS masih belum juga diluncurkan oleh BlackBerry. Perusahaan asal Kanada itu pun belum juga memberikan kapan mereka akan merilis aplikasi tersebut. Namun pihak perusahaan melalui akun Twitternya mengungkapkan bahwa mereka berkomitmen untuk meluncurkan BBM di Android dan iOS.

“Tetap berkomitmen untuk mendatangkan #BBM ke Android dan iPhone. Sign Up di http://BBM.com untuk mengetahui waktu kedatangan #BBM4All,” ujar BlackBerry.
Seperti diketahui, pihak BlackBerry pada awalnya merencanakan kedatangan aplikasi BBM untuk Android pada 21 September dan iPhone pada 22 September kemarin. Namun pihak perusahaan melakukan penundaan dengan alasan adanya kebocoran aplikasi BBM di platform Android. Akibatnya, server BlackBerry pun mengalami permasalahan.
Sebelumnya, BlackBerry juga sempat mengungkapkan bahwa mereka tidak akan mendatangkan BlackBerry untuk Android dan iOS dalam waktu dekat. Kedatangan aplikasi tersebut akan dilakukan jika permasalahan yang sebelumnya terjadi bisa diselesaikan.
Game The Amazing Spider-Man Segera Sambangi Pengguna Konsol PlayStation VITA Bulan Depan
Tag :
info teknology
Kabar mengembirakan bagi Anda pengguna PS Vita di manapun berada, pasalnya game unggulan terbaru berjudul The Amazing Spider-Man dikabarkan akan segera menyambangi konsol PlayStation Vita bulan depan atau tepatnya pada tanggal 19 November yang akan datang.

Selain bakal disuguhkan rangkaian cerita baru yang mirip dengan versi film layar lebarnya, para gamer nantinya juga akan dapat merasakan fitur baru yang menarik seperti kemampuan pinch dan zoom multi-touch Vita yang memungkinkan pengguna untuk mendrag drop peta mini pada posisi layar yang diinginkan.
Keberadaan kontrol layar sentuh yang diusung oleh PlayStation Vita ke Web Rush memungkinkan keputusan yang lebih tepat hanya dengan sekali tekan saja, sedangkan fitur gyroscopic memungkinkan pengguna untuk mengambil foto halaman depan, memiliki sensasi menggunakan kamera sebenarnya, zoom in dan zoom out.
Google bakal Perkenalkan Smartphone Nexus 5 dengan Android 4.4 KitKat pada 28 Oktober
Tag :
info teknology
Pada tahun lalu, Google secara resmi memperkenalkan Nexus 4 dengan OS Android 4.2 Jelly Bean pada 29 Oktober. Dan di waktu yang hampir bersamaan pada tahun ini, search engine terbesar di dunia tersebut juga bakal memperkenalkan Nexus 5 beserta OS Android KitKat 4.4.

Pihak Google memang tidak mengungkapkan secara resmi mengenai tanggal peluncuran tersebut. Namun KitKat, yang merupakan produk makanan dari Nestle sedikit memberikan tanda-tanda bahwa peluncuran smartphone Nexus dan Android KitKat bakal dilakukan pada 28 Oktober nanti.
Tanda-tanda tersebut mereka ungkapkan melalui akun Twitternya pada 15 Oktober kemarin. Pertama, KitKat men-tweet “Everybody Dance Now!”, sebuah lagu yang dinyanyikan oleh band bernama C+C Music Factory. Dan band tersebut pada awalnya bernama The 28th Street Crew.
Selanjutnya pada 16 Oktober kemarin, KitKat pun men-Tweet “Kadang Anda harus melihat tanda-tanda” disertai dengan gambar bertuliskan “This Is It”, sebuah film Michael Jackson yang diluncurkan pada 28 Oktober. Dan seperti yang diungkapkan di awal, maka kemungkinan besar pihak Google akan meluncurkan smartphone Nexus terbaru beserta OS Android KitKat pada 28 Oktober nanti.
via Pocket-lint
Smartphone Oppo N1 yang baru saja diperkenalkan di tanah air memang menjadi handphone pintar pertama dengan kamera rotasi. Dan produsen smartphone Android Cina lainnya, siap mengikuti jejak Oppo. Adalah smartphone Vivo X3 yang baru saja muncul dalam sebuah bocoran gambar lengkap dengan tampilan desain kamera rotasinya.

Smartphone tersebut menariknya bakal menggunakan kamera Nikon. Dalam gambar tersebut juga diperlihatkan bahwa kamera tersebut memiliki desain rotasi yang berbeda dengan Oppo N1. Namun kamera tersebut memiliki desain berputar yang mirip dengan handphone Nokia Express Music 5700. Bedanya, jika Nokia 5700 kameranya berada pada keypad, maka posisi kamera Vivo X3 berada di bagian atas.
Vivo sempat mengungkapkan bahwa smartphone ini bakal dilengkapi dengan sensor 1/1.7 inci 20.2MP CMOS dengan aperture f/2.0. Kamera tersebut juga dilengkapi dengan chip Nikon Expeed. Dengan spesifikasi tersebut, smartphone kamera ini bakal memberikan tantangan serius untuk smartphone kamera lain di pasaran.
Usia sistem operasi Windows XP milik Microsoft tinggal beberapa bulan lagi. Pihak Microsoft bakal secara resmi menghentikan dukungan untuk sistem operasi tersebut pada bulan April 2014 mendatang. Meskipun begitu, Google masih menyediakan update salah satu aplikasi miliknya di Windows XP hingga 2015.

Dalam sebuah pernyataan resminya di blog Chrome, Google mengatakan bahwa dukungan browser Chrome untuk Windows XP bakal dilakukan hingga bulan April 2015. Google mengatakan bahwa masih banyak pengguna Chrome yang masih mengandalkan sistem operasi Windows XP. Tak hanya itu, Google juga mengatakan bahwa masih banyak organisasi yang memiliki puluhan aplikasi di XP dan membuatnya kesulitan untuk bermigrasi ke OS lain.
Dengan adanya dukungan hingga April 2015, Google berharap bisa membantu para pengguna Windows XP pada masa transisi tersebut. Dengan adanya dukungan tersebut, pengguna Windows XP masih bisa mendapatkan update secara otomatis bagi Chrome miliknya sebagai perlindungan terhadap serangan malware.
Panasonic Lumix GM1 Kamera Mirrorless Terkecil dengan Sensor 16Mp, Wifi & Desain Retro
Tag :
info teknology
Panasonic baru saja mengumumkan Lumix DMC GM1 yang merupakan kamera Micro Four Third Terkecil dengan 16Mp Digital Live MOS Sensor dan Venus Engine dalam fisik berukuran hanya 98.5 mm x 54.9 mm x 30.4 mm, yang masih lebih kecil dibanding Sony RX100 II. Layar LCD Lumix GM1 memiliki ukuran 3 inci, dilengkapi Wifi, flash pop-up serta desain retro aluminium yang mengikuti gaya desain kamera FujiFilm.

Sensor pada GM1 sama dengan yang di GX7 dengan kecepatan shutter 1/16000 sec dan mendukung ISO dari 200 sampai high ISO 25600, dan bisa dikatakan kamera ini adalah miniatur dari GX7 tanpa viewfinder dan hotshoe. Untuk perekaman video, kamera kompak ini mampu merekam video berkualitas Full HD.

Harga Kamera Lumix GM1 ini adalah 749.9 USD atau sekitar 8 jutaan rupiah dengan kit lensa 12-32 mm f/3.5-5.6 collapsable lens tapi belum diketahui kapan pastinya akan dipasarkan, kemungkinan besar adalah November nanti.

Overview
Flowcharts are used in designing and documenting complex processes or programs. Like other types of diagrams, they help visualize what is going on and thereby help the viewer to understand a process, and perhaps also find flaws, bottlenecks, and other less-obvious features within it. There are many different types of flowcharts, and each type has its own repertoire of boxes and notational conventions. The two most common types of boxes in a flowchart are:
- a processing step, usually called activity, and denoted as a rectangular box
- a decision, usually denoted as a diamond.
A flowchart is described as "cross-functional" when the page is divided into different swimlanes describing the control of different organizational units. A symbol appearing in a particular "lane" is within the control of that organizational unit. This technique allows the author to locate the responsibility for performing an action or making a decision correctly, showing the responsibility of each organizational unit for different parts of a single process.
Flowcharts depict certain aspects of processes and they are usually complemented by other types of diagram. For instance, Kaoru Ishikawa defined the flowchart as one of the seven basic tools of quality control, next to the histogram, Pareto chart, check sheet, control chart, cause-and-effect diagram, and the scatter diagram. Similarly, in UML, a standard concept-modeling notation used in software development, the activity diagram, which is a type of flowchart, is just one of many different diagram types.
Nassi-Shneiderman diagrams are an alternative notation for process flow.
Common alternate names include: flowchart, process flowchart, functional flowchart, process map, process chart, functional process chart, business process model, process model, process flow diagram, work flow diagram, business flow diagram. The terms "flowchart" and "flow chart" are used interchangeably.
History

The first structured method for documenting process flow, the "flow process chart", was introduced by Frank Gilbreth to members of the American Society of Mechanical Engineers (ASME) in 1921 in the presentation “Process Charts—First Steps in Finding the One Best Way”.[2] Gilbreth's tools quickly found their way into industrial engineering curricula. In the early 1930s, an industrial engineer, Allan H. Mogensen began training business people in the use of some of the tools of industrial engineering at his Work Simplification Conferences in Lake Placid, New York.
A 1944 graduate of Mogensen's class, Art Spinanger, took the tools back to Procter and Gamble where he developed their Deliberate Methods Change Program. Another 1944 graduate, Ben S. Graham, Director of Formcraft Engineering at Standard Register Industrial, adapted the flow process chart to information processing with his development of the multi-flow process chart to display multiple documents and their relationships.[3] In 1947, ASME adopted a symbol set derived from Gilbreth's original work as the ASME Standard for Process Charts.
Douglas Hartree explains that Herman Goldstine and John von Neumann developed a flowchart (originally, diagram) to plan computer programs.[4] His contemporary account is endorsed by IBM engineers[5] and by Goldstine's personal recollections.[6] The original programming flowcharts of Goldstine and von Neumann can be seen in their unpublished report, "Planning and coding of problems for an electronic computing instrument, Part II, Volume 1" (1947), which is reproduced in von Neumann's collected works.[7]
Flowcharts used to be a popular means for describing computer algorithms and are still used for this purpose.[8] Modern techniques such as UMLactivity diagrams can be considered to be extensions of the flowchart. In the 1970s the popularity of flowcharts as an own method decreased when interactive computer terminals and third-generation programming languages became the common tools of the trade, since algorithms can be expressed much more concisely as source code in such a language, and also because designing algorithms using flowcharts was more likely to result in spaghetti code because of the need for gotos to describe arbitrary jumps in control flow. Often pseudo-code is used, which uses the common idioms of such languages without strictly adhering to the details of a particular one.
Flowchart building blocks
Examples


A flowchart for computing the factorial of N — written N! and equal to 1 × 2 × 3 × ... × N.
Symbols
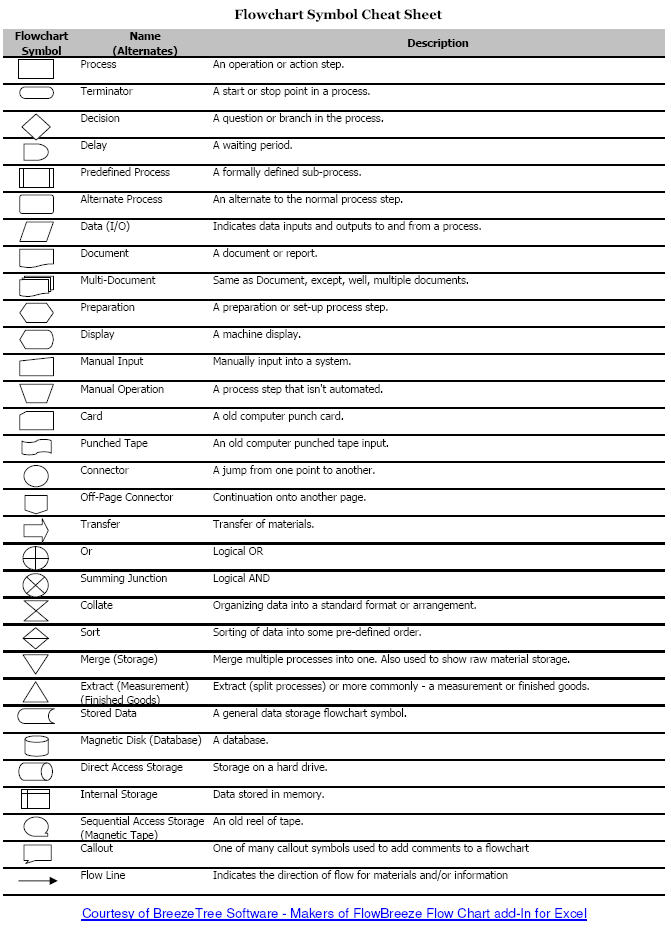
FlowChart Symbols List A typical flowchart from older basic computer science textbooks may have the following kinds of symbols:
- Start and end symbols
- Represented as circles, ovals or rounded (fillet) rectangles, usually containing the word "Start" or "End", or another phrase signaling the start or end of a process, such as "submit inquiry" or "receive product".
- Arrows
- Showing "flow of control". An arrow coming from one symbol and ending at another symbol represents that control passes to the symbol the arrow points to. The line for the arrow can be solid or dashed. The meaning of the arrow with dashed line may differ from one flowchart to another and can be defined in the legend.
- Generic processing steps
- Represented as rectangles. Examples: "Add 1 to X"; "replace identified part"; "save changes" or similar.
- Subroutines
- Represented as rectangles with double-struck vertical edges; these are used to show complex processing steps which may be detailed in a separate flowchart. Example: process-files. One subroutine may have multiple distinct entry points or exit flows (see coroutine); if so, these are shown as labeled 'wells' in the rectangle, and control arrows connect to these 'wells'.
- Input/Output
- Represented as a parallelogram. Examples: Get X from the user; display X.
- Prepare conditional
- Represented as a hexagon. Shows operations which have no effect other than preparing a value for a subsequent conditional or decision step (see below).
- Conditional or decision
- Represented as a diamond (rhombus) showing where a decision is necessary, commonly a Yes/No question or True/False test. The conditional symbol is peculiar in that it has two arrows coming out of it, usually from the bottom point and right point, one corresponding to Yes or True, and one corresponding to No or False. (The arrows should always be labeled.) More than two arrows can be used, but this is normally a clear indicator that a complex decision is being taken, in which case it may need to be broken-down further or replaced with the "pre-defined process" symbol.
- Junction symbol
- Generally represented with a black blob, showing where multiple control flows converge in a single exit flow. A junction symbol will have more than one arrow coming into it, but only one going out.
- In simple cases, one may simply have an arrow point to another arrow instead. These are useful to represent an iterative process (what in Computer Science is called a loop). A loop may, for example, consist of a connector where control first enters, processing steps, a conditional with one arrow exiting the loop, and one going back to the connector.
- For additional clarity, wherever two lines accidentally cross in the drawing, one of them may be drawn with a small semicircle over the other, showing that no junction is intended.
- Labeled connectors
- Represented by an identifying label inside a circle. Labeled connectors are used in complex or multi-sheet diagrams to substitute for arrows. For each label, the "outflow" connector must always be unique, but there may be any number of "inflow" connectors. In this case, a junction in control flow is implied.
- Concurrency symbol
- Represented by a double transverse line with any number of entry and exit arrows. These symbols are used whenever two or more control flows must operate simultaneously. The exit flows are activated concurrently when all of the entry flows have reached the concurrency symbol. A concurrency symbol with a single entry flow is a fork; one with a single exit flow is a join.
All processes should flow from top to bottom and left to right.
Data-flow extensions
A number of symbols have been standardized for data flow diagrams to represent data flow, rather than control flow. These symbols may also be used in control flowcharts (e.g. to substitute for the parallelogram symbol).
- A Document represented as a rectangle with a wavy base;
- A Manual input represented by quadrilateral, with the top irregularly sloping up from left to right. An example would be to signify data-entry from a form;
- A Manual operation represented by a trapezoid with the longest parallel side at the top, to represent an operation or adjustment to process that can only be made manually.
- A Data File represented by a cylinder.
Types of flowchart
Sterneckert (2003) suggested that flowcharts can be modeled from the perspective of different user groups (such as managers, system analysts and clerks) and that there are four general types:[9]
- Document flowcharts, showing controls over a document-flow through a system
- Data flowcharts, showing controls over a data-flow in a system
- System flowcharts showing controls at a physical or resource level
- Program flowchart, showing the controls in a program within a system
Notice that every type of flowchart focuses on some kind of control, rather than on the particular flow itself.[9]
However there are several of these classifications. For example Andrew Veronis (1978) named three basic types of flowcharts: the system flowchart, the general flowchart, and the detailed flowchart.[10] That same year Marilyn Bohl (1978) stated "in practice, two kinds of flowcharts are used in solution planning: system flowcharts and program flowcharts...".[11] More recently Mark A. Fryman (2001) stated that there are more differences: "Decision flowcharts, logic flowcharts, systems flowcharts, product flowcharts, and process flowcharts are just a few of the different types of flowcharts that are used in business and government".[12]
In addition, many diagram techniques exist that are similar to flowcharts but carry a different name, such as UML activity diagram.
Software
Any drawing program can be used to create flowchart diagrams, but these will have no underlying data model to share data with databases or other programs such as project managementsystems or spreadsheets. Some tools offer special support for flowchart drawing. Many software packages exist that can create flowcharts automatically, either directly from source code, or from a flowchart description language. On-line Web-based versions of such programs are available.
sumber : http//http://en.wikipedia.org/wiki/Flowchart


 Posts
Posts